Can Computers Make Art?
Of course not, you might say. They are machines! Creativity is what makes us human. Art is the epitomy of creativity, and thus the epitomy of humanity. If machines can make art, then what are we?
Let me introduce you to the Portrait of Edmond Belamy sold for $432,500 at Christie’s art auction in October 2018. On the surface, this portrait looks like just another painting. It vaguely resembles a portrait of a man but has some quirky characteristics that one might attribute to the author’s peculiar vision - the unfinished edges, the blurry face, the studded texture. Is it worth $432,500? I’ll leave that up to you to decide.
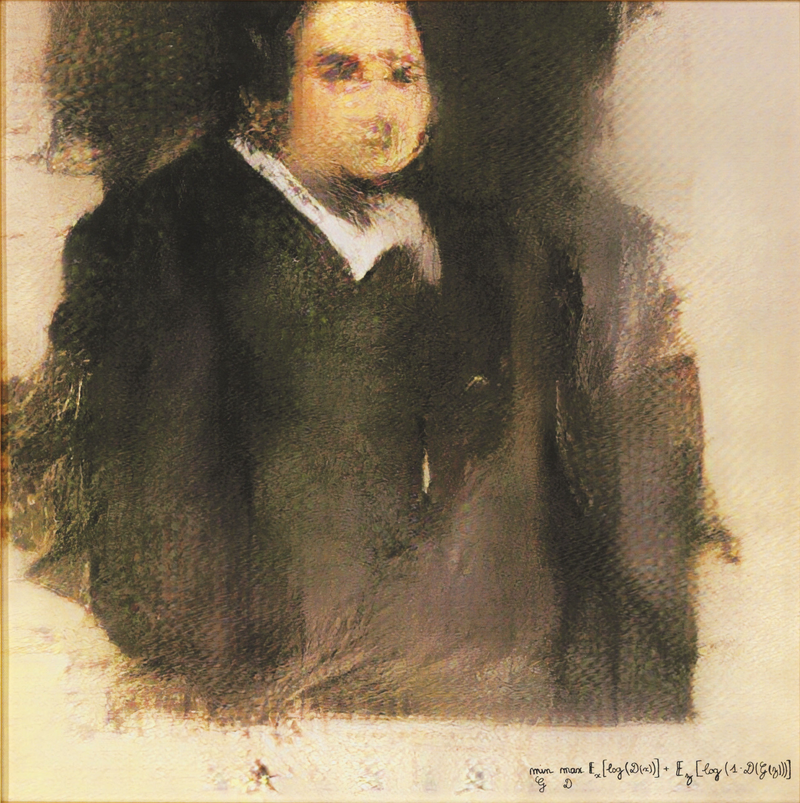
Figure 1: Portrait of Edmond Belamy by Obvious
Alone in the corner is a series of characters where you might normally expect an artist’s signature. To the uninitiated, these characters resemble something that looks like a mathematical function. What a strange thing to put on a piece of art, you might say! To those familiar with deep learning neural networks, you have already figured it out. These characters spell out a network’s loss function meaning that this work of art was produced by a machine.

Figure 2: Loss Function Signature of Portrait of Edmond Belamy by Obvious
I invite you to read the article on the Christie’s website for the full story behind this painting. To summarize, the Portrait of Edmond Belamy was produced by a French art collective known as Obvious that focuses on the boundaries between art and artificial intelligence. For this portrait, they used a type of network known as a Generative Adversarial Network (or GAN; more on these below) trained on 15,000 portraits painted between the 14th and 20th centuries.
With this knowledge in hand, I ask you again - can computers make art? Obvious and Christie’s seem to think so. Or at least, they believe that algorithms can aid in the creation of art. After all, did the art come in the form of the painting or of the process the artists used to train and produce the painting? How about a musician using a backing track produced by AI? Is that laziness on the behalf of the musician or digital, new-age creativity?
These are the questions that inspired me to pursue the topic of Novel 3D Object Generation for the capstone project of my Masters of Information and Data Science (MIDS) program at UC Berkeley. Obvious proved the viability of AI-assisted art in the 2D space with the Portrait of Edward Belamy, but what about 3D art? Can data science and machine learning be utilized to produce novel 3D shapes and designs worthy of being called “art”?
In this post, I will show you, the reader, how my team and I tackled this question. We will start by first refining the question and assessing other business applications of such a system, then I’ll introduce you to the related literature that served as inspiration for our work, and finally we’ll walk through our approach including our successes, failures, and our final results.
The Team
Before I start talking about the project, I need to introduce and give credit to my teammates, Dave and Cynthia. Dave Owen provided our team with much needed business acumen and made sure to keep us on track as the project progressed. He also deserves credit for coming up with and formulating the idea behind the project. Cynthia Hu and I represented the technical side of the team. Her real-world data science experience and willingness to really dig into the details of our research paper references proved invaluable throughout the project. My primary contributions were in data pipeline development, model development, and model training.
Dave and Cynthia were a pleasure to work with. Even in the moments of doubt where we questioned our chances of success, they hung around and listened to my crazy ideas for what we could try next. Thank you David and Cynthia!
What is a Capstone Project?
The MIDS Capstone project is part of the course W210 Synthetic Capstone (I’m not sure why it is called “synthetic” - it felt very real to me) and is taken at the end of a student’s MIDS experience. The course’s and thus project’s goal is to give students the chance to utilize the skills they’ve learned throughout the program to produce a real-world application or solution.
The Project
Refining The Question
All good ideas start with a question. You’ve just been introduced to ours: Can neural networks produce 3D objects worthy of being called art? But be warned, not all questions are good questions.
In our case, our question was good enough to get us started but not to drive forward progress and give us real, actionable direction. We know
The first project pitfall identified by both us and our instructors was the vagueness and ambiguity of art. How do you measure it? How do you determine bad from good?
Related Literature
Call me crazy, but I enjoyed reading research papers for this project. The folks in this field are both insanely creative and incrediby clever. My impression of the papers I read were that this field is still wide open - no one’s truly figured out how to communicate the complexities of 3D shapes to a neural network. Most papers dealt only with voxelized objects (and so did we). A few were brave enough to venture into the triangular mesh category. In this section, I cover the most influential to our project as well as one extra paper that I think is worth reading.
Working with 3D Data
I’d like to start this section with a question for the reader: how would you represent data in the 3D space? If you already know the answer, then skip ahead. If you don’t, then start by thinking about how data is represented in the 2D space: an NxM grid of pixels. These pixels can be, for example in a black and white photo, a single number representing their grayscale value (the shade between black and white). Each pixel location could also contain a vector containg, for example, that pixel’s four RGBA values and so on and so forth.
Voxels
If you expand the concept of the NxM grid from 2D to 3D, then you arrive at the logical data representation of the voxel grid. A voxel is a 3D pixel and it looks exactly as you would expect (think Minecraft).
![Figure 5: Visual example of voxels (from Wikipedia) [1]](/blog/Voxels.svg)
Figure 5: Visual example of voxels (from Wikipedia) [1]
These voxel grids, like 2D grids, can contain a variety of data in the third dimension. For the purposes of this project and for much of the existing research in this area, that third dimension is generally populated by either a 0 or a 1 representing if a voxel exists in that space or not. This data structure is conveniently easy to use to feed to and train a neural network as many of the existing 2D algorithms can be extended and applied to the third dimension.
The drawback of voxel grids is the storage and thus memory space required. If a 28x28 image of an MNIST digit (from the MNIST dataset) contains 28x28 ints (and we assume in this case that an int requires 4 bytes), then that image requires 28 * 28 * 4 = 3,136 bytes. With the third dimension, that single image becomes 28 * 28 * 28 * 4 = 87,808 bytes. With 70,000 digits, that increase can be pretty dramatic as illustrated in the table below.
| Data | 2D | 3D |
|---|---|---|
| Single digit | 3,136 B | 87,808 B |
| Full dataset | 219.52 MB | 6146.56 MB |
That’s a storage/memory footprint increase of 28x (logically)! But how many pictures in the real world do you encounter that are only 28x28? Probably zero unless you do machine learning and play with the MNIST dataset. As an example, my Google Pixel 2 smartphone takes pictures that come in at a resolution of 1920x1080. Imagine adding a third dimension to that!
Lastly, I would be amiss if I did not mention that this project and many others rely heavily on the amazing work put into the free binvox application. Binvox comes as an executable packed with an astonishing number of features to support converting and manipulating voxel representations.
Triangular Meshes
If you’ve ever watched a Pixar film or played a video game that isn’t Minecraft, then you’ve seen triangular meshes at work. A triangular mesh is simply a series of triangles that link together to form some type of object or plane.
![Cute example of a triangular mesh also known as a wireframe [src]](/blog/wireframe-mesh-bunny.png)
Cute example of a triangular mesh also known as a wireframe [src]
With a high enough “poly count” (poly == triangle), graphics engines can produce realistic looking images by using triangular meshes to smooth over edges and create round surfaces (as opposed to the cubic nature of voxels).
Meshes also improve upon the voxel’s storage limitation. Meshes can be represented as a simple array of coordinates where (ideally) each triangular shares at least two vertices (or one edge) with another triangle. Here’s a demonstration with a fabulous rendering via Microsoft Paint:
![Rendering of Table N’s triangles and vertices (the artist does not have the skills required to draw in the third dimension so please do your best to imagine it) [src]](/blog/triangle-mesh-example.png)
Rendering of Table N’s triangles and vertices (the artist does not have the skills required to draw in the third dimension so please do your best to imagine it) [src]
| Triangle | Vertex | X | Y | Z |
|---|---|---|---|---|
| 1 | A | 0 | 0 | 0 |
| 1 | B | 0 | 1 | 0 |
| 1 | C | 0 | 1 | 1 |
| 2 | A | 0 | 0 | 0 |
| 2 | B | 0 | 0 | 1 |
| 2 | C | 0 | 1 | 1 |
The exact storage requirement of a given triangle mesh depends on (1) the number of triangles and (2) the file format. There are many file formats available - too many to list here - that offer various features like color or arcs. We focused on the formats used commonly in 3D printing and chose to start with the simplest available: the STL file.
Mesh Generation
Data: Thingi10k
Model 1: STL VAE
Implementation: https://github.com/workmanjack/3d-form/blob/master/src/models/stl_vae.py


Figure 1: STL VAE attempted squirrel reconstruction (top: original, bottom: reconstruction) at epochs 0 - 90
Model 2: STL GAN
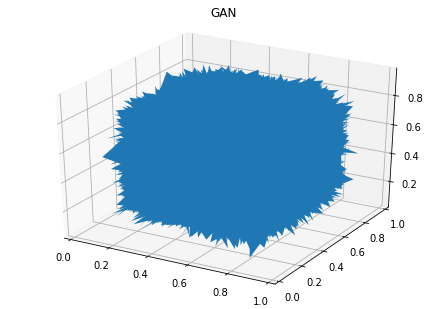
Figure 2: STL GAN output
Model 3: STL VAE-GAN
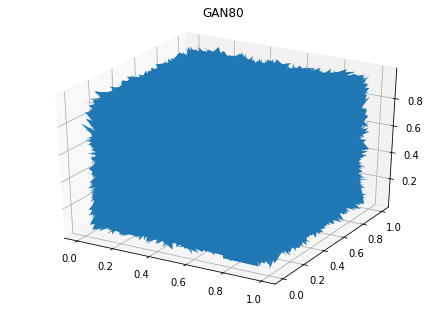
Figure 2: STL GAN output
Model 4: STL RNN

Figure 2: STL RNN output full view demonstrating curve of triangle stack

Figure 3: STL RNN output close up of triangles
Voxel Generation
Data: ModelNet10
Model 5: Voxel VAE
Model 6: Voxel VAE-GAN
Model 7: Voxel VAE 2.0
Bump to 64x64x64 Machine Upgrade
Takeaways
Conclusion
Resources
References
[1] By Vossman; M. W. Toews - Own work; originally created in w:Adobe Illustrator, and later in a text editor, CC BY-SA 2.5, Link