How can data science be applied to the weight room?
Chances are, you or someone you know are a member of a gym or an athletic club and lift weights periodically. Numerous companies provide gym membership benefits to their employees or host weight rooms on their campuses. Weight lifting is pervasive: it is used by both casual and professional athletes as part of their training programmes. With all of these people lifting weights, there must be some rich, analyzeable data out there for data scientists to play with, right?
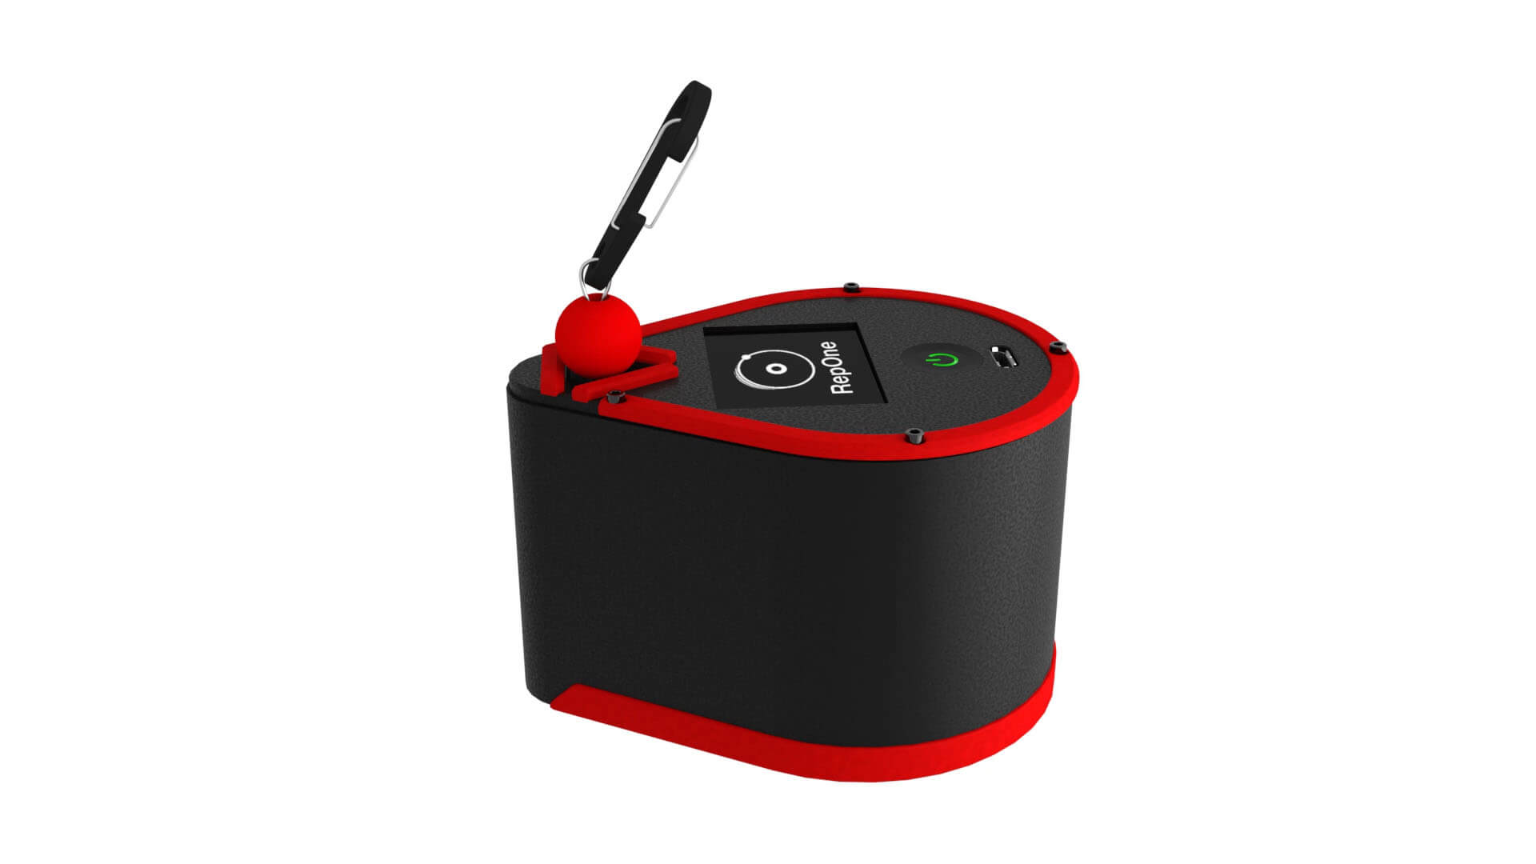
Unfortunately, no. Gyms know when and how often you visit and fitness trackers track your heart rate and step count while lifting, but the actual act of counting repetitions and weight lifted is largely a manual exercise. I say largely because I recently learned of an organization exploring a solution to automatically recording weight lifting metrics. They go by the name of RepOne (formerly OpenBarbell) and produce and distribute a device that attaches to your equipment to track and record your lifts. I encourage you to learn more about their product on their website.
I was introduced to RepOne by a fellow classmate, Yulia Zamriy, in UC Berkeley’s Master of Information and Data Science program. Yulia was interning for the RepOne gym at the time and was looking to use RepOne’s data for the final project of our W207 Applied Machine Learning course. I joined her team alongside Renzee Reyes and Tim Witthoefft, and together we began to explore the data made available by RepOne.
Questions
Our project focused on two primary questions:
Can we use machine learning to accurately classify exercise type based on measurements taken by the OpenBarbell device?
Is there an inherent grouping of lifters based on their lifting parameters (i.e., velocity, range of motion, etc.) that could be leveraged to introduce automation and individualize their training?
Our team used python, scikit-learn, and Jupyter notebooks to explore and model the data. We experimented with both supervised and unsupervised algorithms including K-Nearest-Neighbors, Random Forest, Logistic Regression, Naive Bayes, and Hierarchical Clustering.
Data
The RepOne dataset records the actions of lifters in a weightroom. The data was provided to us as JSON with the following fields:
- Metadata: Set ID, Rep Number, App Version, Timestamp
- User Input: Exercise Label, Weight, Rate of Perceived Exertion
- Exercise in Motion: Average Velocity, Range of Motion, Peak Velocity, Peak Velocity Location, Rep Duration
In total, we had over 100,000 recorded exercises totaling over 200,000 repetitions performed. That’s pretty good!
Results
To read more about our application of these algorithms and our results, I highly encourage you to read the white paper authored by my teammate, Yulia Zamriy. She did a fantastic job summarizing our work - so good that I see no reason to attempt to top it.
My contributions primarily centered on question #2 from above: lifter clustering. Specifically, I created a tool in Google Colab that enabled us to rapidly iterate during the feature engineering phase. The tool, pictured below, gave us the ability to experiment with different combinations of variables, aggregators, and algorithm parameters without changing any code. I was inspired to create the tool because the code was slowly becoming unwieldy - too many comments attempting to explain and preserve past experiments alongside copying and pasting leading to repeat human error.
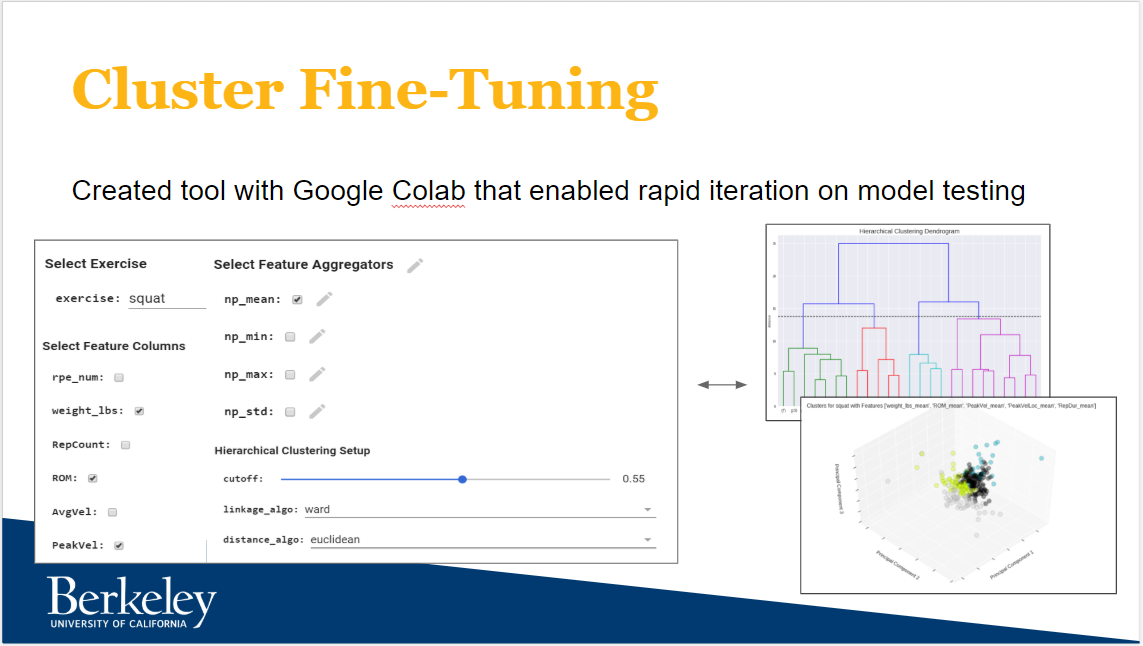
Figure 1: The Cluster Fine-Tuning tool created for feature engineering in Google Colab
My favorite part of the tool was the visualizations it produced. The team worked hard experimenting with various methods to best capture the output of the unsupervised hierarchical clustering algorithm. We settled on a dendogram to help us understand the breakdown of the clusters as well as educate our decision on the proper cutoff (i.e. where we cease segregation clusters - seen as the black dotted line in Figure 2) and a standard 3D scatter plot after using PCA to reduce the dimensionality of the data (Figure 3).
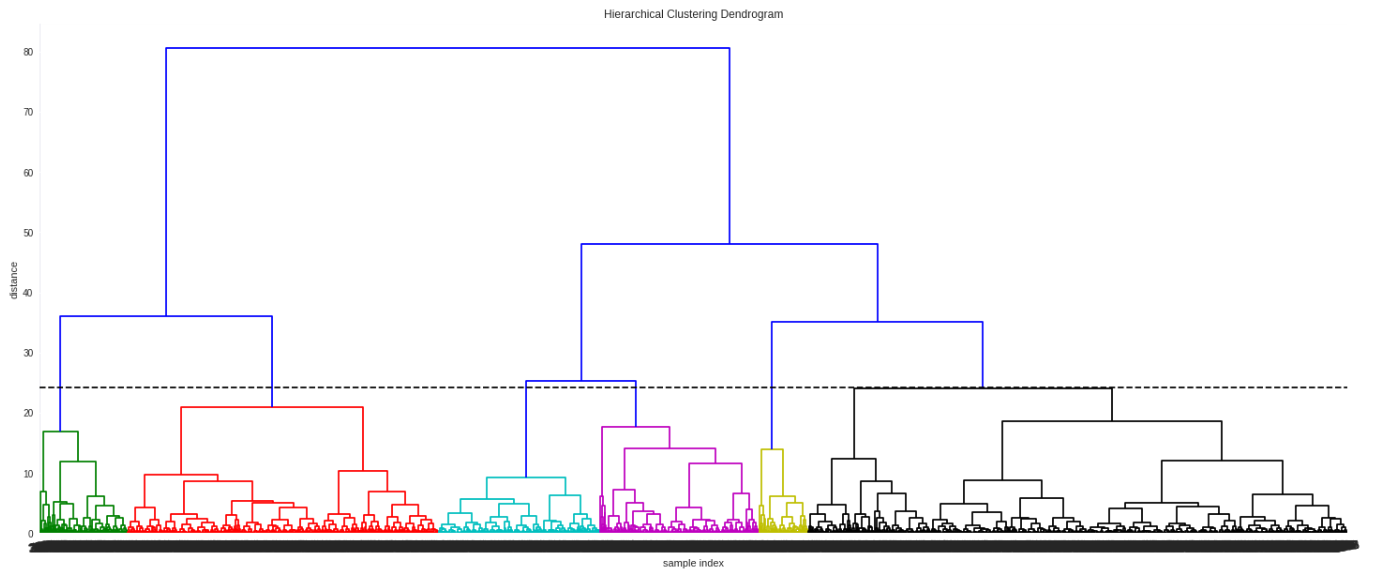
Figure 2: An example of the dendogram used to visualize the hierarchical clustering algorithm
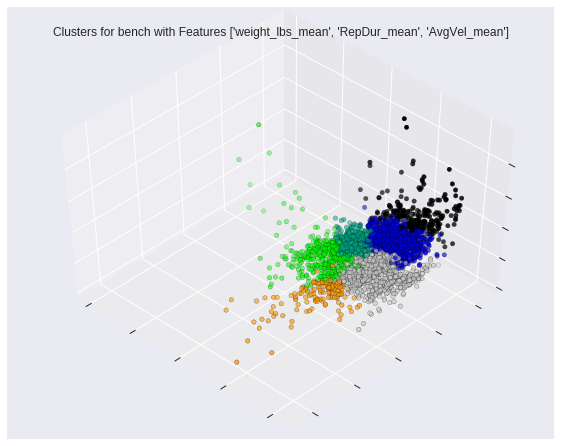
Figure 3: An example of the 3D scatter plot used to visualize cluster separation
As a proof-of-concept to show why clustering by lifters is valuable, I utilized the slider / number-line concept to show a user how they stand in relation to the rest of the lifters in their clusters. The purpose of this visualization is to demonstrate a user’s realistic areas of improvement. You would not suggest to a 100lb lifter that they should strive to lift more weight to match the 200lb lifter. Instead, you would point out another 100lb lifter who is lifting more weight as an example and as motivation. The same idea applies here. In Figure 4, the given user has a much lower than average “Peak Velocity” than the other lifters in their cluster signaling a possible area of improvement.
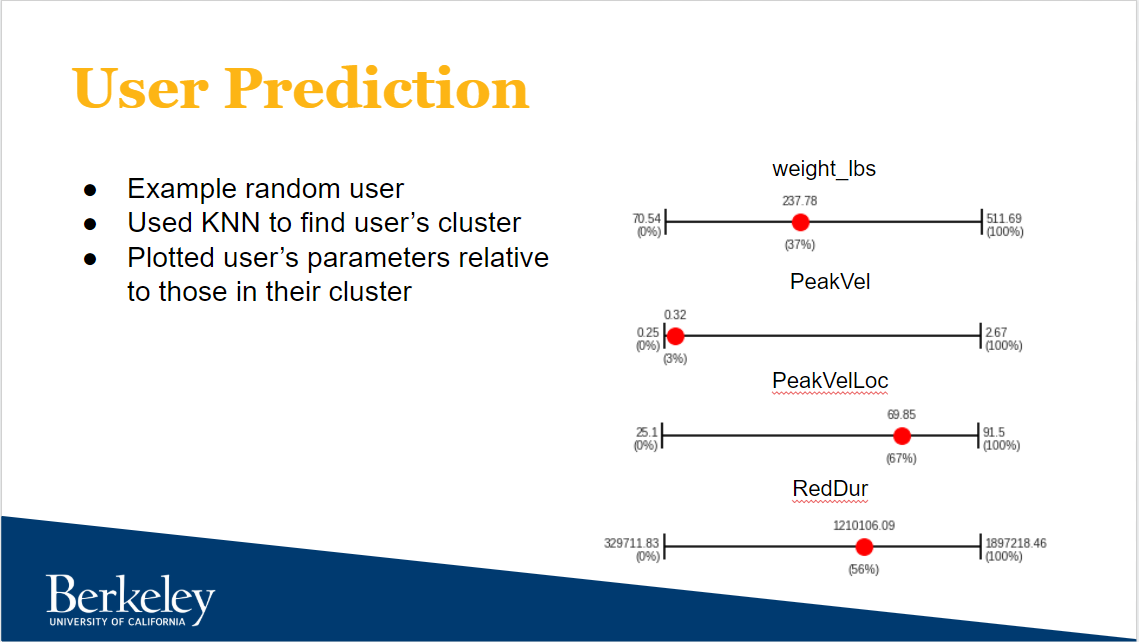
Figure 4: Using a slider to demonstrate where a lifter stands relative to other lifters in their cluster
Takeaways
1. The Value of Domain Knowledge
Obviously, this project would not have been possible without Yulia’s connections with RepOne. Not so obvious is that this project would not have been possible without Yulia and her domain expertise of being a powerlifter. Being somewhat of an athlete, I like to pretend that I can at least fumble my way around the weightroom, but when it comes time to discussing peak veloctiy of a lift and how that might be used to classify exercises, it really helps having someone in the room that lifts regularly and understands the theory behind the number. Sometimes (or perhaps most of the time depending on your work environment), you are not as fortunate to have access to someone like Yulia. That brings us to Takeaway #2…
2. The Art of Exploratory Data Analysis (EDA)
The first time I opened up the RepOne dataset, I think it is fair to say that I did not know where to begin. I recognized words like “rep”, “squat”, and “weight” well enough that I could understand that user 724 did 10 reps of exercise squat with weight of 210, but how are those values connected to “range of motion” and “peak velocity”? What do those relationships mean? That exact question was answered by Yulia (see Takeaway #1), but we could not rely on Yulia for everything - just as you cannot rely on your coworker or your significant other for everything. Sooner or later you have to carry your own weight. Short of going into a weight room and experimenting with tossing some weights around (which by the way, throwing yourself into the given domain is not a bad way to quickly get up to speed), you can leverage one of data science’s most powerful tools: Exploratory Data Analysis (EDA).
The idea behind an EDA is simple: explore your data. Bring the dataset up in an r session or in a python jupyter notebook and start looking at the fields and their means, maximums, minimums, and quartiles. Start plotting fields as histograms to examine the distributions, against time (if available) to possibly find trends, and against each other to hunt for correlations.
You’ll know you are doing your EDA correctly when you begin making hypotheses about what the data might be able to tell you. Maybe you theorize that a lift’s “Rate of Perceived Exertion” increases with the “Rep Number”? Or maybe that “Peak Velocity” is highest when “Range of Motion” is also at its highest?
Your EDA of the data never really stops. It, and the rest of the machine learning workflow, is an iterative process. At some point, you will need to move forward and begin constructing a model. How do you know when it is time to move forward? I recommend doing so after you (1) are confident that you possess at least a high-level understanding of the dataset and its fields and (2) after you have discovered relationships between the fields that give promise to answering the original business question. After building your first model, you are ready for Takeaway #3…
3. Feature Engineering
Feature Engineering is the bread and butter of all “shallow” machine learning work. The flow works like this: begin with a question, analyze your data for a relationship you can exploit to solve the question, build a model on that relationship, execute the model to find an answer, and then spend your remaining time tuning the model to produce better and more accurate answers. That final step is called feature engineering in shallow machine learning (in deep learning, you can engineer your features but you can also spend time tuning your loss functions and/or your network architecture) and usually takes the form of adding/removing variables and/or manipulating them in some way.
Using this project as an example of the aforementioned flow, from our EDA we determined that “Range of Motion” correlated strongly with the different types of exercises. We used this relationship as the foundation of our model and produced an answer. We then improved that answer by adding “Peak Velocity”, “Weight”, and other variables.
This project was actually my first real exposure to prolonged feature engineering. In the homework assignments leading up to the project, the focus was on producing working models and not necessarily performant models. Now that performance mattered, the team and I really dug into finding the best variable and model configuration to answer the given question. This is, as I said before, what led me to develop the Cluster Fine-Tuning tool we used to do our feature engineering. My software engineering background is always urging me to “work smarter, not harder”, and I look forward to continuing to apply my software development best practices to the machine learning lifecycle.
Final Thoughts
Like many people, I tend to show up in a gym every now and again (you are much more likely to find me outside running or hiking). Thanks to this project, whenever I now go to a gym, I find myself thinking about where the peak velocity of my lift is. I’m not a powerlifter; I’m not going to pretend to know how that knowledge translates into helping me lift better, but I definitely feel more of a connection with the sport.
I want to thank my teammates for the quality work they put into this project. As far as group projects go, this was one of my more enjoyable group project experiences. We learned not only about powerlifting but also about how to collaborate on a machine learning project. My next post will be about my experiences in W266 Natural Language Processing with Deep Learning where there is also an end-of-semester group project. Stay tuned!